


With artificial intelligence, building products has become significantly easier and faster. What has not become easier is tracking the cost of building them.
Imagine a technology company receiving a bill from its cloud services provider. The finance department can easily tell how much was spent, even if it cannot say precisely why. Meanwhile, the engineering team can look at the fine print to see which capabilities it used but may not immediately know the cost of each workload, application or customer.
As technology companies spread their infrastructure across cloud providers, Kubernetes clusters and a growing collection of AI services, the distance between what a company consumes and what it pays for can become surprisingly difficult to bridge.
Flexera’s 2026 State of the Cloud report estimates that 29% of IaaS and PaaS cloud spending is wasted, as the proliferation of AI and new cloud services adds to the complexity of managing infrastructure.
Some 85% of organisations surveyed said managing cloud spend remained a major challenge. Large enterprises are particularly exposed, as 76% now spend more than $5m a month on public cloud.
It is a problem Emmanuel Bakare has seen repeatedly in more than a decade as a software engineer and the inspiration for CostGraph, a cost infrastructure platform that makes the economics of modern technology infrastructure easier to understand and act on.
Building an enterprise cost management function
Bakare first began building what would become CostGraph while working at Twilio, the cloud communications company.
The initial idea was to identify areas of the company’s cloud infrastructure and broader technical operations where costs could be reduced, then demonstrate why those savings mattered.
Bakare describes CostGraph as a cost-management platform that helps technology companies track usage, pricing and billing. Its ambition, however, extends beyond producing another dashboard for a finance team.
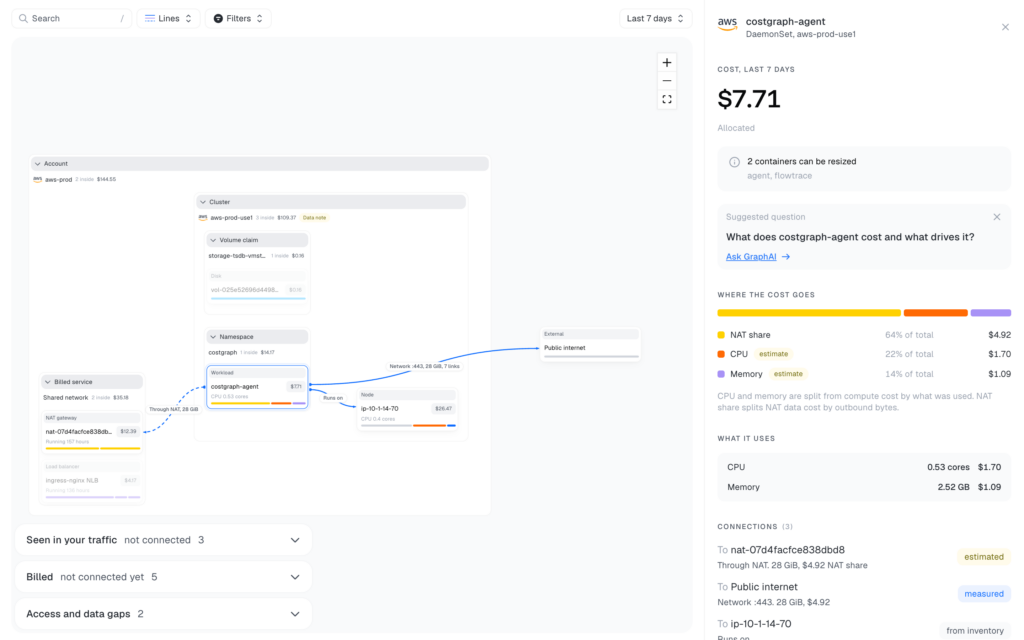
The company combines information about what infrastructure is being used with its associated costs, then uses that information to identify inefficiencies, explain changes in spending and recommend what customers might do next.
When CostGraph first launched, its focus was Kubernetes and virtual machines. Over the past year, Bakare says, the company’s assumptions about what customers actually wanted have changed, as has the scope of the product.
CostGraph now presents itself as a platform for cloud-cost optimisation, rightsizing and recommendations across cloud and on-premise infrastructure, with integrations spanning AWS, Google Cloud and newer sources of AI-related spending such as OpenRouter.
It also manages hardware and partners with platforms running inference and data centre workloads for customers across the US and Europe.
That shift reflects a broader change in the market. The first generation of FinOps software was largely concerned with visibility: how much a company spent, where spending went and which teams should be charged for it. The next generation is trying to answer a harder question: what should the company do about it? CostGraph does everything.
The competitive landscape
CostGraph sits in a competitive market. OpenCost, an open-source cost monitoring tool provides visibility into Kubernetes and cloud spending and allows costs to be allocated across clusters, namespaces and workloads.
Kubecost builds a commercial product around that underlying allocation technology. Other FinOps platforms, including Vantage and CloudZero, approach the problem from a broader cloud-billing and business perspective.
CostGraph’s bet is that these distinctions are becoming less useful as technology estates become more complicated.
A company’s infrastructure may now include AWS and Google Cloud alongside Kubernetes, on-premise servers, GPU providers and AI APIs. Understanding any one of these in isolation is less useful than understanding how they contribute to the same technology bill.
That creates a potentially large market. A company spending $100m a year on cloud infrastructure does not need to eliminate a large share of its spending for optimisation software to become financially meaningful.
The challenge, according to Bakare, is that saving money has not always been enough to persuade customers to use the product. CostGraph allows a connected view of usage to spend on billing across any dimension, including networking across billed units.
Over the past year, CostGraph’s team has seen some of its assumptions about user behaviour challenged. Some customers arrived specifically because they wanted to reduce their infrastructure bills.
Others were less interested in savings and instead used CostGraph for observability, using its data to understand what was happening across their infrastructure. High valued companies have piloted its software for billing and invoicing whilst utilising its metering features for product development.
“Usage and recommendations can be as important as taking actions,” Bakare says, noting that customers use the information CostGraph produces in different ways depending on their needs.
Flexera’s research suggests that nearly half of organisations now use unit economics to connect technology spending with services and business outcomes, while 64% measure the value delivered to business units.
FinOps, once largely concerned with controlling cloud bills, is becoming a broader discipline for understanding the value generated by technology, and AI is making that transition even more urgent.
For CostGraph, the longer-term opportunity therefore may be less about producing a better cloud-spending dashboard than about becoming a layer between technology infrastructure and the decisions companies make about it.
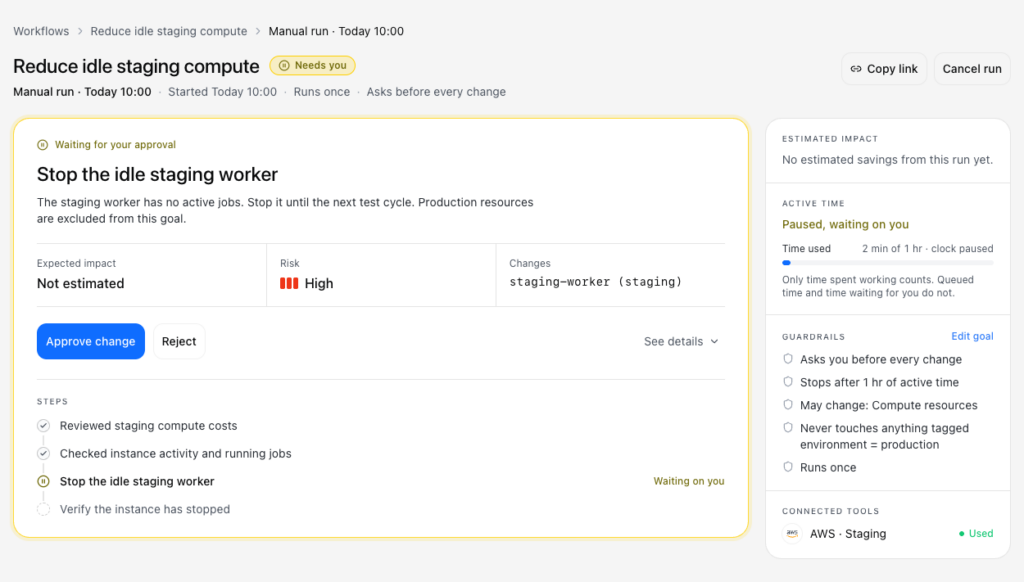
Today, that can mean identifying an over-provisioned workload or explaining an unexpected increase in spending. Eventually, it could mean allowing software to make some of those changes itself.
That last step is also where the industry becomes more complicated. An application that appears expensive may be intentionally over-provisioned because a company values resilience over efficiency.
Reducing capacity may save money but increase the risk of an outage. A useful optimisation system therefore needs to understand not only what infrastructure costs are but also why it has been configured that way and what might happen if it changes.
The founding team
Bakare brings a diverse background to CostGraph. As an electrical and electronics engineering undergraduate at the University of Lagos, he served as campus lead of the University’s Google Developer Group, which grew from about ten members to more than 1,000 under his leadership. He was also part of the team that built Replex before its acquisition at Cisco.
After graduating, he worked at a number of technology companies in Nigeria and Europe, including Interswitch, Amazon Web Services, Clipboard Health and Deimos. He later obtained a postgraduate law degree from the University of Law and an MBA from the Quantic School of Business and Technology.
He is joined at CostGraph by co-founder and chief marketing officer Jubril Oyetunji and CTO Umegbewe Nwebedu.
Prior to joining CostGraph, Oyetunji spent years driving developer education on topics such as the cloud and Kubernetes, most notably for the sovereign cloud provider, Civo, as well as maintaining an open-source project used by Fortune 500 companies.
Nwebedu has a background in site reliability engineering, cloud infrastructure and distributed systems. He previously worked at a number of technology companies in the US, including Botanix Labs and Gala Games, building and scaling production infrastructure. He is also an active mentor with the Linux Foundation’s LFX Mentorship programme.
CostGraph is already revenue-generating, although Bakare declined to share exact figures. The startup is also in the process of raising its first round of institutional capital, which will help it scale and reach more users.